In one of my first posts – “How Much Light Is Needed Inside the Camera?” – I showed you what a good exposure is by displaying three images taken from the same point with different exposures (in fact it was a simple exposure bracketing). I added later the luminance histogram over each image to understand the usage of this valuable tool. But first…
The histogram allows us to evaluate the exposure by observing the shape of the graph; dividing the graph in three sections (dark, medium, bright) helps to evaluate what tones dominate the image:
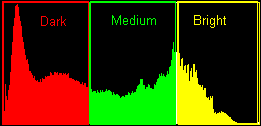 (the colors of the sections in the above diagram are purely illustrative and have nothing to do with the colors found in the image).
- If the histogram covers the entire graph (i.e. it extends over the whole horizontal axis) without significant gaps, the image is normally exposed and with a good tonal range.
- If the histogram covers more the dark section of the graph and less the other two sections, the image is probably underexposed.
- If the histogram covers more the bright section of the graph and less the other two sections, the image is probably overexposed.
- If the histogram is concentrated more in the central section of the graph and less the other two sections, the image is probably exposed properly but lacks contrast (e.g. a picture taken in the fog).
- If the histogram is concentrated more in the dark and bright sections and presents a significant gap corresponding to the central section, the image is probably exposed properly but the contrast is high (e.g. a picture taken in full sun with dark shadows).
Most cameras will try to expose in such a way that the histogram is properly balanced. This will produce images that are exposed correctly from a strictly technical point of view. However, the photographer may have a different idea based on his (or hers) artistic intentions and experience: a “skewed” histogram can serve better in certain situations.
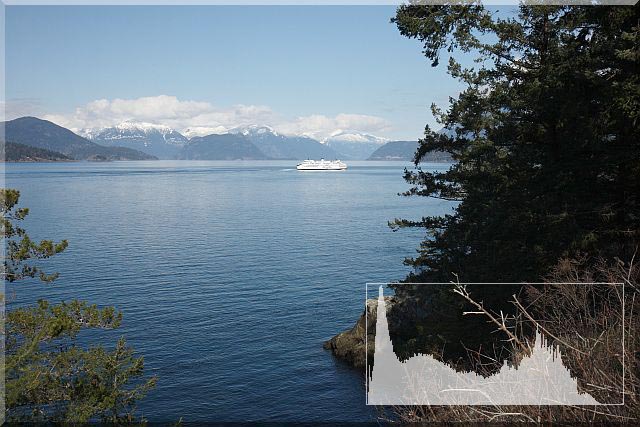
Here is the normally exposed image:
As we can see, the histogram shows a relatively well balanced image (maybe a tiny bit underexposed) with a good tonal distribution (not too many gaps in the histogram). Because the histogram expands almost from one side to the other of the graph, we can say that the image has probably good contrast (a low contrast image will only occupy a portion of the graph as we will see later).
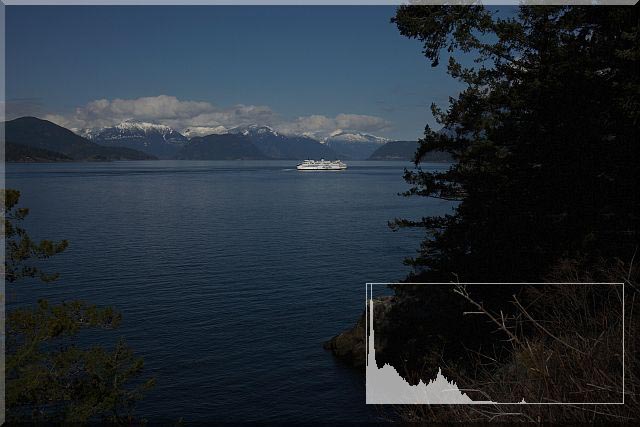
The next image is underexposed:
It is easy to observe that most of the histogram is concentrated on the dark section of the graph while the bright side is almost empty. An exposure correction of around +1EV can fix the image and balance the histogram.
Finally the following is the overexposed version of the same scene:
At the first glance the histogram of this image may look deceiving: all three sections of the histogram appear populated. Without seeing the image, you may think that the exposure was about right. In reality, a good portion of the histogram is located on the bright side indicating that the highlights are probably too bright with chances that some details may be lost (due to the saturation of the sensor). If you look at the picture it becomes obvious that the image was overexposed: the clouds and the mountain peaks are very hard to discern, the ship looks washed and without contour.
The conclusion is that you better stay away of the histogram edges, especially the bright side that will make exposure corrections in post processing almost impossible. So, in most circumstances, try to shoot for the highlights – i.e. push the histogram to the (b)right side as much as necessary without actually touching it. A slight underexposure (like in the first image) is preferable than overexposure in order to allow some post processing later. Obviously, a visual inspection of the image is always necessary.
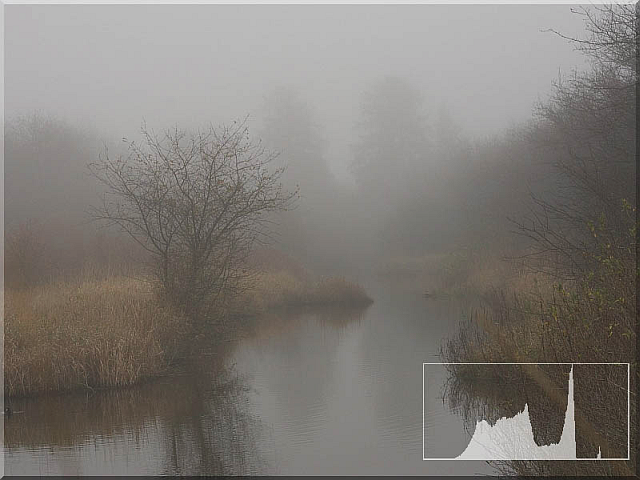
The picture that I used in this example has enough contrast to cover the entire tonal range (or the entire histogram). Not all the pictures will display a wide histogram when analyzed. For example, pictures taken in a foggy atmosphere have narrow histograms usually placed in the central section of the graph:
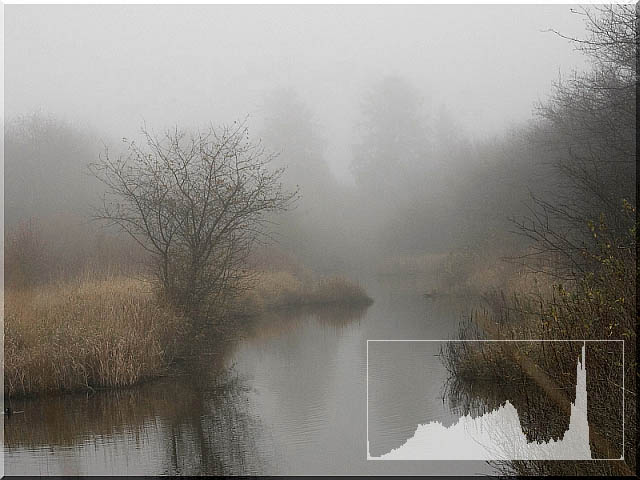
Such histogram does not indicate something wrong with the image – it only shows that the contrast is low… naturally! Trying to modify the image so that the histogram is extended to cover the entire tonal range would produce somewhat unnatural results:
As you can see, the increased contrast does not help too much here: the first image is probably closer to the real foggy atmosphere of that misty morning, while the second one seems a bit artificial.
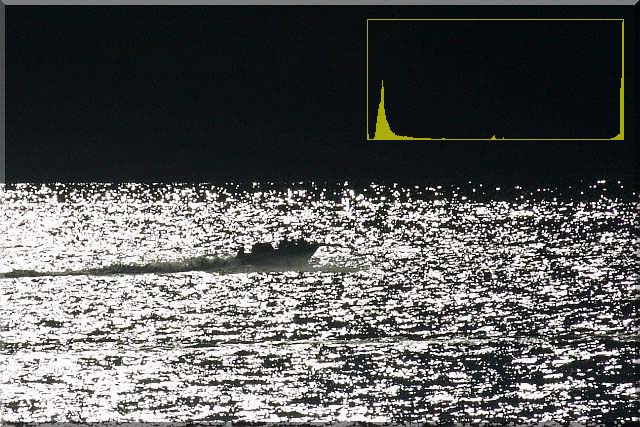
Finally, an example of extreme contrast:
The histogram is concentrated only in the dark and in the bright sections: there are (almost) no gradients, there is no tonal richness. This image looks similar to an old black-and-white lithography, except it was taken with a color camera (!!!) that was incapable to reproduce the extremely high dynamic range of tones without clipping the highlights and pushing everything else in the shadows. However, the result isn’t totally without some artistic value: in fact the whole point in shooting in such harsh lighting conditions was exactly this black-and-white image where the silhouette of the boat detaches from the glittery surface of the lake (and only suggesting the actual scene).
Understanding histograms and their use is an important step in becoming better accustomed to the digital camera in particular and to the digital photography in general. Is it always intuitive? Initially, the answer may be “not always”. But after some practice you will realize the power of this instrument.
We will continue to use histograms while analyzing images and moving to color histograms used as a tool to fine tune the exposure in color photography. The main goal is to get to a perfect color reproduction, especially in the highlights, where the luminance histogram may not be enough to determine the correct exposure despite of its normal appearance. However, I would consider this subject an advanced topic and return to it later in a separate post. In the mean time, get used to the luminance histogram and use it whenever possible. It will help you to become a better photographer (if you are not one already).

