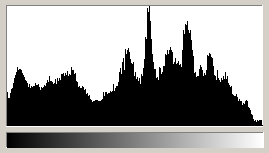
As a general definition, the histogram is a graphical representation of the distribution of data. “What distribution of data?” you may ask. Well, in a digital camera, like in a computer, an image is just data! I know, this may not resonate with your emotions or artistic feelings when you see a photography that you like. Nor you will feel compelled to find out more about histograms: in the end, the photographers worked for years on film without using histograms and they still produced great images.
As I will demonstrate in the next few posts, the histogram may become the most useful tool available for you as a photographer using a digital camera (and subsequently a computer for post processing). Mastering the histograms will give you the ability to better understand some fundamental concepts like contrast, tonal distribution, dynamic range or lighting conditions and will also help you to evaluate the exposure more accurately and showing you what adjustments work the best in different situations.
Digitizing Images
It is finally the time to understand how the image sensor really works and what is the nature of the data representing an image. Initially, I will limit the discussion to grayscale (or black and white) images and return to color later when necessary.
In “Light and Colors – Part 3” post I talked a bit about the light and color perception by the human eye. The image sensor follows similar principles using an array of tiny photosensitive elements similar to the eye’s cone receptors. In both cases an electrical signal is produced. While our brain processes that signal in its analogue form creating the image in our conscience, the digital camera changes these signals in numbers, generating lots of data through a process called analogue to digital (A/D) conversion or digitization. Once transformed into data the image can be stored, modified, archived, etc.
Regardless of whether light focused on a scene ultimately impacts on the human retina, a film emulsion, a phosphorescent screen or the photodiode array of a digital camera sensor, an analog image is produced. These images can contain a wide spectrum of intensities and colors. Images of this type are referred to as continuous tone because the various tonal shades and hues blend together without disruption. Continuous tone images accurately record image data by using a sequence of electrical signal fluctuations that vary continuously throughout the image – i.e. analog signals.
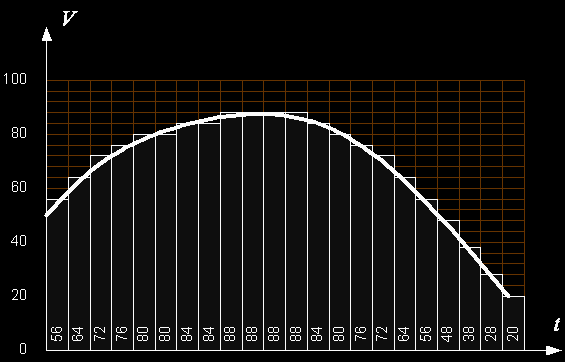
In a digital camera, the analog signals from the sensor are converted into numbers through a process of sampling and quantization (or, simply, digitization). The following diagram suggests how the digitization takes place; note that the values on the V axis represent percentage of the maximum value of the signal (corresponding to white color representation). As we will see later, the numbers used in digital imaging use different scales, usually dictated by technological reasons and by standard image formats used in computer processing or storage.
Images are generally square or rectangular thus each pixel is represented by a coordinate pair with specific x and y values, arranged in a typical Cartesian coordinate system. The x coordinate specifies the horizontal position or column location of the pixel, while the y coordinate indicates the row number or vertical position. Thus, a digital image is composed of a rectangular or square pixel array representing a series of intensity values that is ordered by an (x, y) coordinate system like in the following drawing:
Note: in reality, the image exists only as a large serial array of data values that can be interpreted by a computer to produce a digital representation of the original scene.
The numbers in each cell represent the values associated to the electrical signals produced by each photosensitive element on a scale of 0 to 255 (256 distinct values). This is probably the most common scale currently in use for intensity representation (see, for example, the most common image file formats like JPEG, GIF, TIFF, BMP or PNG for more details). Value 0 is used to represent a “no light” condition and 255 is used to indicate the saturation of the sensor when the light energy becomes greater than the photosensitive elements can handle.
The scale mentioned above may not be accurate enough in comparison to what the human eye can process but it is a reasonable scale that satisfies the requirements of the image representation on monitors or printed paper. I will return later with more on digital imaging and different image representations in computers or digital cameras; I will also stop on the dynamic range of an image and consequences for the photographer.
Introducing the Histogram
The idea of analyzing the pixel value distribution in an image has its roots in statistics (see this Histogram article) where it has been used as a tool to estimate of the probability distribution of a continuous variable since the end of the 19th century.
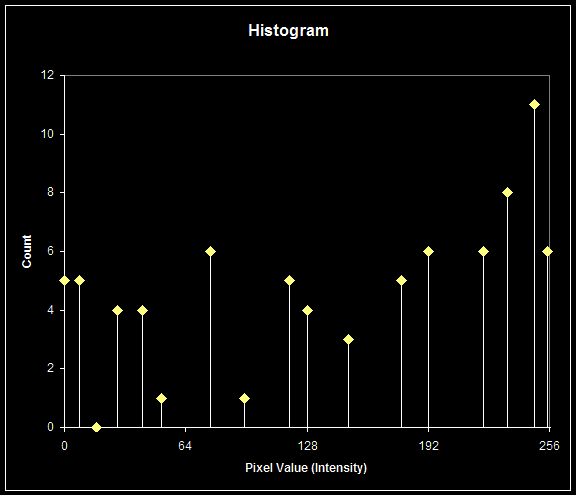
In digital imaging the histogram is determined by counting pixels of a certain intensity value and representing graphically the resulting numbers as a curve using the intensity as horizontal axis. As an example I will use the 10 x 8 pixel image introduced in the description of image digitization; after counting the pixels as described, the histogram looks like this:
Given such a small array (80 pixels), it is obvious that the histogram will only show a limited number of values other than 0. In fact, in some cases, histograms may present “gaps” like the above. This is not something wrong, or incorrect: it is what it is and nothing else.
In practice, we don’t care too much of the values on each axis of a histogram: we always assume the intensity in the 0…255 (or 0…100%) range on the horizontal axis and the pixel count on the vertical axis (with a maximum equal to the number of pixels in the image). As consequence, cameras (but sometimes computer programs) do not display any units on the histogram. What matters is the shape of the histogram.
The following is a computer generated image – a square of 453 x 453 pixels – displaying a gradient of grey tones between 128 and 192 (on the same 0…255 scale):
The histogram shows a limited range of tonal distribution, indicating a low contrast image.
The next image has the same size but displaying a full gradient from 0 to 255:
As we can see, the histogram covers the whole range of tonal distribution, indicating a normal contrast image.
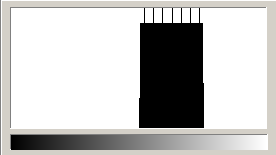
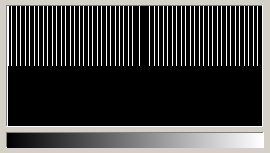
The next image (same size) is an extreme case of almost black (intensity = 16) and almost white (intensity = 240) without any other tones between:
The histogram of the image is concentrated in two points (or bars) indicating an extreme contrast limited in this case to two intensities: one for (almost) black and one for (almost) white. This may be the case of a black and white printing device (e.g. a laser printer) not capable of modulating the intensity of the pixels other than through dithering (approximating tones using an intentionally applied form of noise).
Finally, a real black and white photography:
Its histogram shows a broad tonal range (almost ideal) covering almost everything from black (left side) to white (right side).
In conclusion, the histogram allows us to estimate the tonal range of an image before taking any decisions to influence it (for example, by modifying camera settings before taking the final shot). This will be the subject of one of the next posts.
Stay tuned for more to come on this subject.

