 There are many books and papers dedicated to the study of light from different perspectives: the artist, the scientist, the designer, the historian or the biologist. There is no point in repeating here what the literature provides in abundance. The goal of this post is to introduce some concepts that will be used later in other posts so that the reader will not have to spend hours searching for basic definitions.
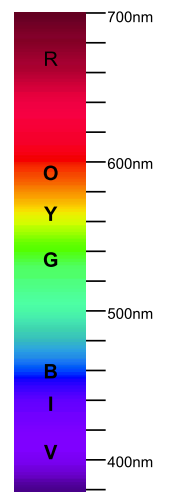
Generally speaking the light is the electromagnetic radiation within the part of the spectrum visible to the human eye: with wavelengths approximately between 400 and 700 nm [1]. There are only two ways that can affect the wavelength composition of light: emission and absorption.
The emission caused by a chemical or physical process is always related to the light source. There is no naturally occurring “perfect” white light source in the sense that the spectrum is flat (i.e. it emits the same amount of each wavelength). What the human eye perceive as white is very subjective: each of us sees a different “nuance of white”.
The absorption is the opposite of emission and happens when the light is transformed into a different form of energy.The amount of absorption of each wavelength is dependent on the nature of the object that light touches.
The reflection can be simply reduced to an absorption followed by a re-emission of the light. Usually, some wavelengths are absorbed more than others, so the light that emerges has a different wavelength composition.
Transmission can be reduced to absorption: the amount of absorption of each wavelength, and thus the intensity that emerges from the material, depends on the physical characteristics of that material. There is no such think as the perfect transmitter — only vacuum (theoretically, the absence of matter) could be one.
The light science needs a special absorptive device that converts light into electrical signals: photo sensor (or photo detector).
Colors may result:
- through the emission of certain wavelengths in different proportions;
- from white light through the absorption of certain wavelengths in different proportions.
The spectral curve of an object is its visual fingerprint, describing how the object affects light at each wavelength:
- a reflective object will be characterized by its reflectance graph;
- a transmissive object will be characterized by its transmittance graph;
- an emissive object will be characterized by its emittance graph.
From a purely scientific point of view the spectral data is a complete and unambiguous description of color information. Unfortunately, the way our eye interprets that information is far from being objective.
The light science refers to all the aspects of light either seen as radiation characterized unequivocally by its physical parameters (like spectral data) or based on a statistical model of the human visual response to light:
- radiometry – the science of measuring light in any portion of the electromagnetic spectrum (but usually limited to infrared, visible and ultraviolet);
- photometry – the science of measuring visible light in units that are weighted according to the sensitivity of the human eye;
- colorimetry – the science of color as perceived by the human eye.
References:
- Visible spectrum on Wikipedia
- James M. Palmer; Barbara G. Grant – The Art of Radiometry (SPIE Press Book)
- Appendices section from The Art of Radiometry (above) in PDF format
- Ian Ashdown – Photometry and Radiometry – A Tour Guide for Computer Graphics Enthusiasts in PDF format

